April 2025 Central Texas Housing Market Report

April Market Update: More Affordable Homes, More Choices
Inventory is finally catching up—and that’s good news for buyers.
In April, the number of new listings across the Austin-Round Rock-San Marcos area jumped by more than 11%, reaching 5,710 homes. That boost helped increase total housing inventory to 5.6 months—up from 3.8 months this time last year—giving buyers more time and more options.
While sales were down 13.8% year-over-year, and the median price dipped slightly to $450,000, this shift reflects what’s happening nationally. Higher mortgage rates and economic uncertainty are making some buyers more cautious, but the overall trend points toward a more balanced market.
According to Clare Knapp, Ph.D., housing economist for Unlock MLS and the Austin Board of REALTORS®, Central Texas stands out in a positive way:
“Central Texas’s move toward more balanced market conditions mirrors housing market corrections nationwide, underscoring that what is happening in our market isn’t an anomaly. What’s unique to the Central Texas housing market is its supply of affordably priced inventory. Austin was one of the most affordability-constrained markets emerging from the pandemic. Many parts of the country are still supply-constrained, but in April, the Austin area posted the highest inventory level affordable to the standard household since 2012.”
In other words—while affordability is still a challenge, we’re seeing more homes come to market that the average household can actually afford. That’s a big deal, especially for first-time buyers who’ve struggled in recent years.
Knapp also noted:
“While this signals progress, especially for first-time homebuyers, significant work remains to improve long-term housing affordability across the region, especially as higher mortgage rates and economic turbulence impact buyer confidence.”
So, what does this mean if you’re buying or selling?
Brandy Wuensch, 2025 Unlock MLS and ABoR president, says it’s more important than ever to have the right guidance:
“In today’s dynamic market, it’s important for buyers and sellers to work with a professional agent who can help them understand and act on current opportunities. With more affordable inventory available, a trusted agent can guide buyers through options like down payment assistance, financing alternatives and negotiation strategies.”
“Even with these ongoing market adjustments, Central Texas homes priced competitively are still selling quickly and at or above list price. While the market may feel uncertain, one thing remains clear: homeownership continues to be one of the most powerful tools for building long-term financial stability and creating generational wealth.”
Austin-Round Rock-San Marcos MSA
April 2025 - For Sale
-
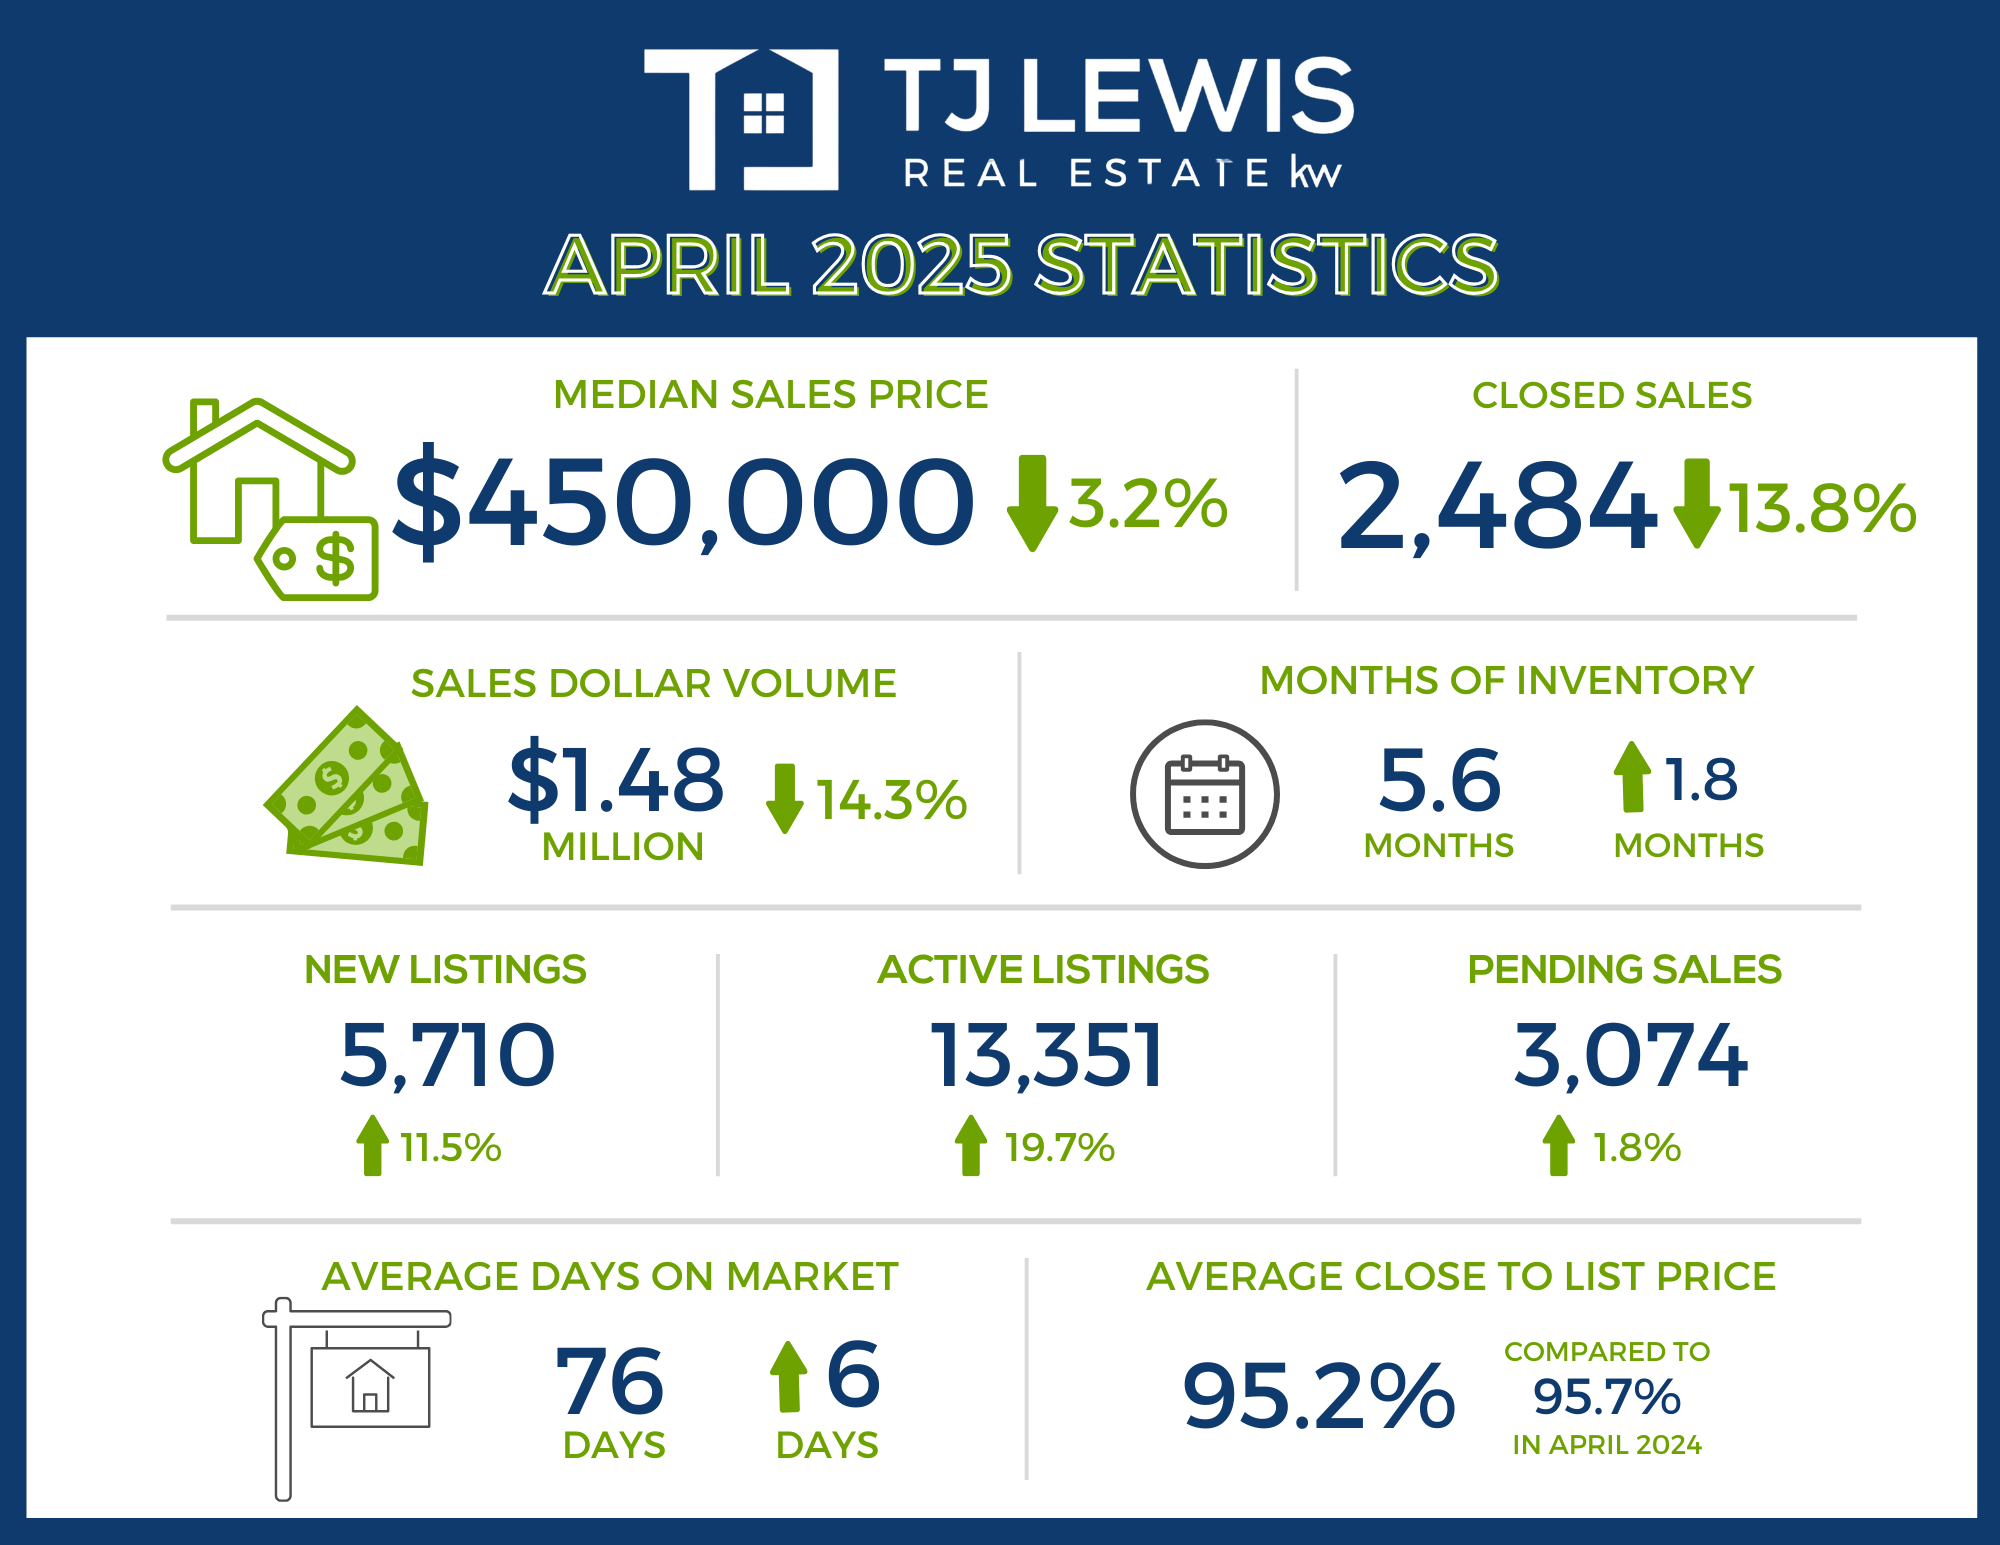
2,484 – Residential homes sold, 13.8% less than April 2024.
-
$450,000 – Median price for residential homes, 3.2% less than April 2024.
-
5,710 – New home listings on the market, 11.5% more than April 2024.
-
13,351 – Active home listings on the market, 19.7% more than April 2024.
-
3,074 – Pending sales, 1.8% more than April 2024.
-
5.6 – Months of inventory, 1.8 months more than April 2024.
-
$1,480,662,458 – Total dollar volume of homes sold, 14.3% less than April 2024.
-
95.2% – Average close to list price, compared to 95.7% in April 2024.
April 2025 - For Lease
-
2,153 – Closed leases, 2.8% less than April 2024.
-
$2,250 – Median price for rent, 2.0% less than April 2024.
-
3,141 – New lease listings on the market, 5.1% more than April 2024.
-
3,975 – Active lease listings on the market, 0.6% less than April 2024.
-
2,468 – Pending leases, 2.5% more than April 2024.
-
1.9 – Months of inventory, 0.1 months more than April 2024
-
$4,462,738 – Total dollar volume of leases, 8.5% less than April 2024.
-
97.8% – Average close to list price, compared to 97.1% in April 2024.
City of Austin
April 2025 - For Sale
-
870 – Residential homes sold, 15.9% less than April 2024.
-
$595,000 – Median price for residential homes, 1.6% more than April 2024.
-
2,287 – New home listings on the market, 12.3% more than April 2024.
-
5,181 – Active home listings on the market, 23.1% more than April 2024.
-
1,044 – Pending sales, 0.6% less than April 2024.
-
6.0 – Months of inventory, 2.0 months more than April 2024.
-
$688,814,951 – Total dollar volume of homes sold, 15.4% less than April 2024.
-
95.3% – Average close to list price, compared to 95.2% in April 2024.
April 2025 - For Lease
-
1,002 – Closed leases, 4.2% less than April 2024.
-
$2,450 – Median price for rent, 1.8% less than April 2024.
-
1,505 – New lease listings on the market, 7.3% more than April 2024.
-
2,030 – Active lease listings on the market, 3.8% less than April 2024.
-
1,175 – Pending leases, 5.2% more than April 2024.
-
2.0 – Months of inventory, flat compared to April 2024.
-
$2,561,804 – Total dollar volume of leases, 4.0% less than April 2024.
-
97.5% – Average close to list price, compared to 96.7% in April 2024.
Travis County
April 2025 - For Sale
-
1,142 – Residential homes sold, 14.2% less than April 2024.
-
$520,000 – Median price for residential homes, 2.8% less than April 2024.
-
2,923 – New home listings on the market, 13.4% more than April 2024.
-
6,791 – Active home listings on the market, 20.0% more than April 2024.
-
1,342 – Pending sales, 0.9% less than April 2024.
-
6.0 – Months of inventory, 1.7 months more than April 2024.
-
$814,491,953 – Total dollar volume of homes sold, 16.8% less than April 2024.
-
95.2% – Average close to list price, compared to 95.0% in April 2024.
April 2025 - For Lease
-
1,170 – Closed leases, 2.4% less than April 2024.
-
$2,400 – Median price for rent, flat compared to April 2024.
-
1,751 – New lease listings on the market, 6.7% more than April 2024.
-
2,416 – Active lease listings on the market, 0.1% more than April 2024.
-
1,343 – Pending leases, 4.7% more than April 2024.
-
2.1 – Months of inventory, 0.1 months more than April 2024.
-
$2,867,678 – Total dollar volume of leases, 2.8% less than April 2024.
-
97.5% – Average close to list price, compared to 96.6% in April 2024.
Williamson County
April 2025 - For Sale
-
817 – Residential homes sold, 18.5% less than April 2024.
-
$435,920 – Median price for residential homes, 1.1% more than April 2024.
-
1,734 – New home listings on the market, 14.2% more than April 2024.
-
3,869 – Active home listings on the market, 26.6% more than April 2024.
-
1,041 – Pending sales, 4.4% more than April 2024.
-
4.8 – Months of inventory, 1.8 months more than April 2024.
-
$399,833,002 – Total dollar volume of homes sold, 18.1% less than April 2024.
-
94.9% – Average close to list price, compared to 97.0% in April 2024.
April 2025 - For Lease
-
690 – Closed leases, 6.6% less than April 2024.
-
$2,150 – Median price for rent, 4.4% less than April 2024.
-
1,037 – New lease listings on the market, 1.4% more than April 2024.
-
1,130 – Active lease listings on the market, 1.9% less than April 2024.
-
838 – Pending leases, 1.3% more than April 2024.
-
1.6 – Months of inventory, 0.1 months more than April 2024.
-
$1,145,908 – Total dollar volume of leases, 22.9% less than April 2024.
-
98.2% – Average close to list price, compared to 98.0% in April 2024.
Hays County
April 2025 - For Sale
-
321 – Residential homes sold, 15.7% less than April 2024.
-
$399,990 – Median price for residential homes, 2.6% more than April 2024.
-
772 – New home listings on the market, 4.6% more than April 2024.
-
1,831 – Active home listings on the market, 7.1% more than April 2024.
-
539 – Pending sales, 12.1% more than April 2024.
-
5.6 – Months of inventory, 1.1 months more than April 2024.
-
$168,536,225 – Total dollar volume of homes sold, 14.3% less than April 2024.
-
96.7% – Average close to list price, compared to 95.0% in April 2024.
April 2025 - For Lease
-
176 – Closed leases, 21.1% less than April 2024.
-
$2,050 – Median price for rent, 6.8% less than April 2024.
-
285 – New lease listings on the market, 15.9% more than April 2024.
-
330 – Active lease listings on the market, 5.4% more than April 2024.
-
233 – Pending leases, flat compared to April 2024.
-
1.8 – Months of inventory, 0.4 months more than April 2024.
-
$253,824 – Total dollar volume of leases, 36.2% less than April 2024.
-
98.3% – Average close to list price, compared to 97.4% in April 2024.
Bastrop County
April 2025 - For Sale
-
91 – Residential homes sold, 25.4% less than April 2024.
-
$344,900 – Median price for residential homes, 3.8% less than April 2024.
-
219 – New home listings on the market, 1.8% less than April 2024.
-
692 – Active home listings on the market, 21.2% more than April 2024.
-
119 – Pending sales, 1.7% less than April 2024.
-
7.6 – Months of inventory, 3.0 months more than April 2024.
-
$38,740,158 – Total dollar volume of homes sold, 20.7% less than April 2024.
-
93.4% – Average close to list price, compared to 94.3% in April 2024.
April 2025 - For Lease
-
33 – Closed leases, 8.3% less than April 2024.
-
$2,100 – Median price for rent, 7.7% more than April 2024.
-
52 – New lease listings on the market, 8.8% less than April 2024.
-
72 – Active lease listings on the market, 4.0% less than April 2024.
-
39 – Pending leases, 17.0% less than April 2024.
-
2.2 – Months of inventory, 0.1 months more than April 2024.
-
$42,414 – Total dollar volume of leases, 21.8% more than April 2024.
-
97.3% – Average close to list price, compared to 97.7% in April 2024.
Caldwell County
April 2025 - For Sale
-
29 – Residential homes sold, 25.4% less than April 2024.
-
$299,990 – Median price for residential homes, 1.0% more than April 2024.
-
62 – New home listings on the market, 1.8% less than April 2024.
-
169 – Active home listings on the market, 9.0% more than April 2024.
-
33 – Pending sales, 1.7% less than April 2024.
-
5.8 – Months of inventory, 2.4 months more than April 2024.
-
$8,990,409 – Total dollar volume of homes sold, 39.9% less than April 2024.
-
94.6% – Average close to list price, compared to 98.4% in April 2024.
April 2025 - For Lease
-
11 – Closed leases, 8.3% less than April 2024.
-
$1,725 – Median price for rent, 9.2% less than April 2024.
-
16 – New lease listings on the market, 8.8% less than April 2024.
-
27 – Active lease listings on the market, 41.3% less than April 2024.
-
15 – Pending leases, 17.0% less than April 2024.
-
2.5 – Months of inventory, 0.2 months less than April 2024.
-
$2,000 – Total dollar volume of leases, 80.5% less than April 2024.
-
97.3% – Average close to list price, compared to 93.7% in April 2024.
For more information or to download the April 2025 Central Texas Housing Market Report, visit UnlockMLS.com/Stats.
Recent Posts