March & Q1 2026 Central Texas Housing Market Report
Central Texas Market Gains Traction as Buyers Reenter in Q1
The Central Texas housing market didn’t just hold steady in the first quarter of 2026—it started to turn a corner.
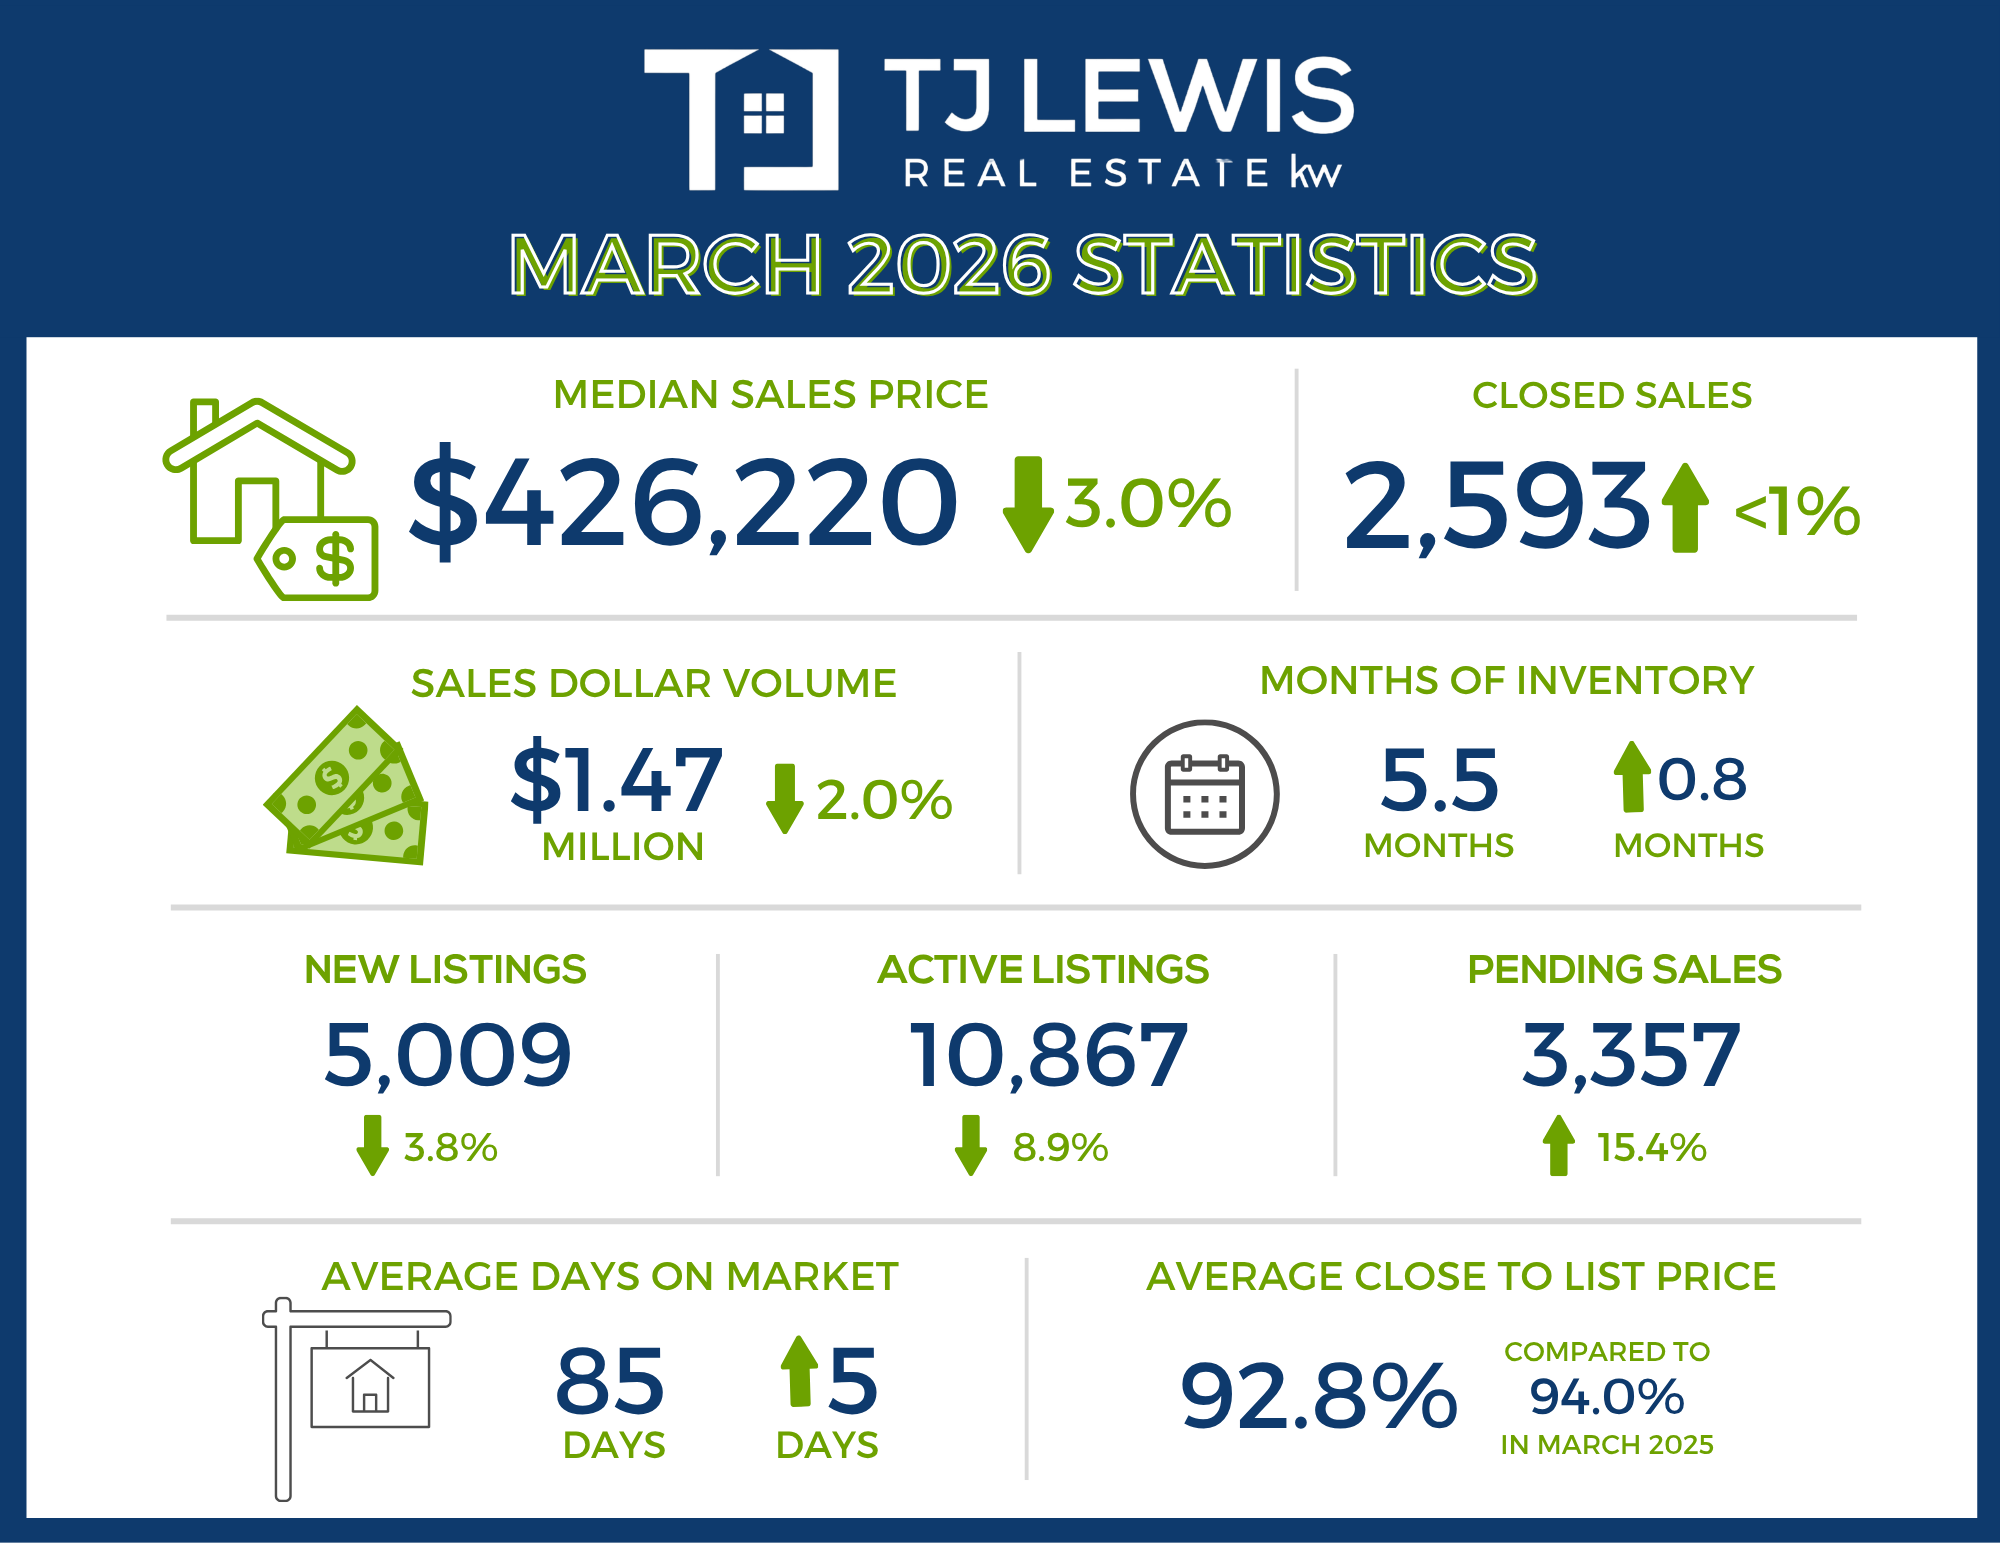
March data, in particular, shows a meaningful shift in buyer behavior. According to the latest Central Texas Housing Report from Unlock MLS, the median home price came in at $426,220, making it the lowest March median price since 2021. That matters. After several years of rapid appreciation, pricing is now creating a more realistic entry point—especially for buyers who have been waiting for the market to become more accessible.
At the same time, closed sales rose to 2,593 transactions, up 0.5% year over year, while pending sales jumped 15.4% to 3,357 transactions. That gap between closed and pending activity is important. It tells us not just where the market has been, but where it’s heading—and right now, it’s pointing toward increased demand moving into the spring season.
When you zoom out to the full first quarter, the story becomes even clearer.
Across Q1, the median home price declined 3.4% to $415,300, while active listings increased 4.5% to 33,751 homes. Inventory expanded to 5.5 months, giving buyers more options and more leverage than they’ve had in recent years.
This is what a recalibrating market looks like.
Prices are adjusting. Inventory is building. And buyers are starting to step back in with more confidence.
Vaike O’Grady, market research advisor at Unlock MLS, pointed out that the real shift happened within the quarter—not just across it:
“What the quarterly figures don’t show is the shift we saw in market activity from February to March. Despite the uncertainty of the global geopolitical environment and higher interest rates, the Central Texas market is settling into a more typical pattern of activity. Double-digit month-over-month increases in pending and closed sales indicate that buyers are out there and making moves when the price is right. At the same time, we’re seeing a window open for buyers who have been priced out in previous years, especially first-time homebuyers, as more attainable pricing creates new opportunities to enter the market with greater confidence.”
That “window” she’s referring to is critical.
For the first time in a while, buyers who were previously on the sidelines—especially first-time buyers—are seeing opportunities that feel within reach. And when that group reenters the market, it tends to create a ripple effect across all price points.
John Crowe, 2026 Unlock MLS and ABoR president, reinforced that success in this type of market comes down to preparation and execution:
“As activity picks up, we’re seeing a market that rewards preparation and strategy. Buyers and sellers who are informed and working with Unlock MLS agents are better positioned to navigate opportunities as they emerge. This is a market where timing and pricing matter, and having the right guidance can make all the difference in finding the right property and closing quickly.”
And that’s exactly what we’re seeing play out.
Homes that are priced correctly are attracting attention. Buyers who are informed are moving decisively. And the overall pace of the market is becoming more intentional—not rushed, not stagnant, but balanced.
As we move deeper into the spring season, the early signal is clear: the Central Texas housing market isn’t just stabilizing—it’s regaining momentum.
For buyers and sellers who understand how to read this shift, that creates a real opportunity to make smart, well-timed moves in a market that’s finally starting to behave in a more predictable—and sustainable—way.
Austin-Round Rock-San Marcos MSA
Q1 2026 - For Sale
-
6,186 – Residential homes sold, 1.8% less than Q1 2025.
-
$415,300 – Median price for residential homes, 3.4% less than Q1 2025.
-
12,322 – New home listings on the market, 2.3% less than Q1 2025.
-
33,751 – Active home listings on the market, 4.5% more than Q1 2025.
-
8,110 – Pending sales, 10.9% more than Q1 2025.
-
5.5 – Months of inventory, 0.3 months more than Q1 2025.
-
$3,410,000,000 – Total dollar volume of homes sold, 3.9% less than Q1 2025.
-
92.6% – Average close to list price, compared to 93.3% in Q1 2025.
March 2026 - For Sale
-
2,593 – Residential homes sold, 0.5% more than March 2025.
-
$426,220 – Median price for residential homes, 3.0% less than March 2025.
-
5,009 – New home listings on the market, 3.8% less than March 2025.
-
10,867 – Active home listings on the market, 8.9% less than March 2025.
-
3,357 – Pending sales, 15.4% more than March 2025.
-
5.5 – Months of inventory, 0.8 more than March 2025.
-
$1,472,720,680 – Total dollar volume of homes sold, 2.0% less than March 2025.
-
92.8% – Average close to list price, compared to 94.0% in March 2025.
March 2026 - For Lease
-
2,746 – Closed leases, 10.5% more than March 2025.
-
$2,000 – Median price for rent, 7.0% less than March 2025.
-
3,240 – New lease listings on the market, 13.0% more than March 2025.
-
3,811 – Active lease listings on the market, 0.3% more than March 2025.
-
3,001 – Pending sales, 13.9% more than March 2025.
-
1.9 – Months of inventory, 0.1 months more than March 2025.
-
$6,106,682 – Total dollar volume of leases, 2.7% more than March 2025.
-
96.4% – Average close to list price, compared to 96.7% in March 2025.
City of Austin
March 2026 - For Sale
-
900 – Residential homes sold, 2.9% more than March 2025.
-
$550,000 – Median price for residential homes, 6.8% less than March 2025.
-
1,927 – New home listings on the market, 9.5% less than March 2025.
-
3,653 – Active home listings on the market, 17.8% less than March 2025.
-
1,077 – Pending sales, 10.5% more than March 2025.
-
5.4 – Months of inventory, 0.3 more than March 2025.
-
$687,620,905 – Total dollar volume of homes sold, 1.5% more than March 2025.
-
93.8% – Average close to list price, flat compared to March 2025.
March 2026 - For Lease
-
1,490 – Closed leases, 24.4% more than March 2025.
-
$2,025 – Median price for rent, 10.0% less than March 2025.
-
1,707 – New lease listings on the market, 18.8% more than March 2025.
-
1,982– Active lease listings on the market, 2.1% more than March 2025.
-
1,546 – Pending sales, 20.2% more than March 2025.
-
2.3 – Months of inventory, 0.2 months more than March 2025.
-
$3,474,111 – Total dollar volume of leases, 10.9% more than March 2025.
-
96.0% – Average close to list price, compared to 96.5% in March 2025.
Travis County
March 2026 - For Sale
-
1,210 – Residential homes sold, 4.0% more than March 2025.
-
$499,000 – Median price for residential homes, 4.0% less than March 2025.
-
2,549 – New home listings on the market, 4.5% less than March 2025.
-
5,162 – Active home listings on the market, 12.0% less than March 2025.
-
1,483 – Pending sales, 15.9% more than March 2025.
-
5.9 – Months of inventory, 0.8 months more than March 2025.
-
$836,586,858 – Total dollar volume of homes sold, 0.3% more than March 2025.
-
93.4% – Average close to list price, compared to 93.9% in March 2025.
March 2026 - For Lease
-
1,649 – Closed leases, 21.1% more than March 2025.
-
$2,000 – Median price for rent, 9.1% less than March 2025.
-
1,961 – New lease listings on the market, 19.2% more than March 2025.
-
2,354 – Active lease listings on the market, 2.3% more than March 2025.
-
1,767 – Pending sales, 21.9% more than March 2025.
-
2.3 – Months of inventory, 0.2 months more than March 2025.
-
$3,814,605 – Total dollar volume of leases, 8.0% more than March 2025.
-
96.0% – Average close to list price, compared to 96.6% in March 2025.
Williamson County
March 2026 - For Sale
-
859 – Residential homes sold, 1.2% more than March 2025.
-
$410,000 – Median price for residential homes, 1.9% less than March 2025.
-
1,531 – New home listings on the market, 1.8% less than March 2025.
-
3,244 – Active home listings on the market, 8.1% less than March 2025.
-
1,153 – Pending sales, 16.1% more than March 2025.
-
4.6 – Months of inventory, 0.4 months more than March 2025.
-
$402,658,786 – Total dollar volume of homes sold, 0.3% less than March 2025.
-
92.7% – Average close to list price, compared to 94.7% in March 2025.
March 2026 - For Lease
-
800 – Closed leases, 2.1% less than March 2025.
-
$2,000 – Median price for rent, 4.8% less than March 2025.
-
879 – New lease listings on the market, 2.5% less than March 2025.
-
976 – Active lease listings on the market, 9.1% less than March 2025.
-
940 – Pending sales, 8.2% more than March 2025.
-
1.4 – Months of inventory, 0.1 months less than March 2025.
-
$1,696,205 – Total dollar volume of leases, 4.0% less than March 2025.
-
97.3% – Average close to list price, compared to 97.0% in March 2025.
Hays County
March 2026 - For Sale
-
368 – Residential homes sold, 6.1% less than March 2025.
-
$381,250 – Median price for residential homes, 0.8% more than March 2025.
-
648 – New home listings on the market, 5.8% less than March 2025.
-
1,565 – Active home listings on the market, 10.1% less than March 2025.
-
511 – Pending sales, 12.6% more than March 2025.
-
5.3 – Months of inventory, 0.8 months more than March 2025.
-
$176,806,333 – Total dollar volume of homes sold, 9.5% less than March 2025.
-
92.5% – Average close to list price, compared to 92.9% March 2025.
March 2026 - For Lease
-
221 – Closed leases, 8.7% less than March 2025.
-
$1,995 – Median price for rent, 2.3% more than March 2025.
-
290 – New lease listings on the market, 32.4% more than March 2025.
-
336 – Active lease listings on the market, 4.0% more than March 2025.
-
223 – Pending sales, 10.4% less than March 2025.
-
1.7 – Months of inventory, flat compared to March 2025.
-
$457,260 – Total dollar volume of leases, 11.4% less than March 2025.
-
96.9% – Average close to list price, compared to 95.9% in March 2025.
Bastrop County
March 2026 - For Sale
-
114 – Residential homes sold, 15.6% less than March 2025.
-
$330,000 – Median price for residential homes, 8.3% less than March 2025.
-
212 – New home listings on the market, 8.6% less than March 2025.
-
708 – Active home listings on the market, 10.6% more than March 2025.
-
154 – Pending sales, 16.7% more than March 2025.
-
8.5 – Months of inventory, 3.4 months more than March 2025.
-
$42,734,539 – Total dollar volume of homes sold, 23.3% less than March 2025.
-
90.1% – Average close to list price, compared to 93.5% in March 2025.
March 2026 - For Lease
-
46 – Closed leases, 7.0% more than March 2025.
-
$2,000 – Median price for rent, flat compared to March 2025.
-
79 – New lease listings on the market, 11.3% more than March 2025.
-
100 – Active lease listings on the market, 38.9% more than March 2025.
-
45 – Pending sales, 2.2% less than March 2025.
-
3.1 – Months of inventory, 1.1 months more than March 2025.
-
$90,248 – Total dollar volume of leases, 2.0% less than March 2025.
-
95.2% – Average close to list price, compared to 96.5% in March 2025.
Caldwell County
March 2026 - For Sale
-
42 – Residential homes sold, 5.0% more than March 2025.
-
$277,500 – Median price for residential homes, 15.5% less than March 2025.
-
69 – New home listings on the market, 11.3% more than March 2025.
-
188 – Active home listings on the market, 23.7% more than March 2025.
-
56 – Pending sales, 9.8% more than March 2025.
-
6.3 – Months of inventory, 1.8 months more than March 2025.
-
$13,934,164– Total dollar volume of homes sold, 3.0% more than March 2025.
-
89.1% – Average close to list price, compared to 92.7% in March 2025.
March 2026 - For Lease
-
30 – Closed leases, 36.4% more than March 2025.
-
$1,625 – Median price for rent, 9.4% less than March 2025.
-
31 – New lease listings on the market, 3.3% more than March 2025.
-
45 – Active lease listings on the market, 60.7% more than March 2025.
-
26 – Pending sales, 23.8% more than March 2025.
-
2.8 – Months of inventory, 1.5 months more than March 2025.
-
$48,364 – Total dollar volume of leases, 30.6% more than March 2025.
-
95.1% – Average close to list price, compared to 97.8% in March 2025.
For more information or to download the March and Q1 2026 Central Texas Housing Market Report, visit UnlockMLS.com/Stats.
Recent Posts