July 2026 Central Texas Housing Market Report

The numbers show continued positive momentum. As Vaike O’Grady of Unlock MLS put it, “Deals are happening, prices are holding and buyers and sellers are finding opportunities equally.” Sales and pending activity both improved year-over-year, yet the pace of new contracts flattened compared with the stronger spring months. Inventory is building not because of a flood of new listings (those were down 2.8%), but because fewer sellers are withdrawing when their homes don’t sell quickly. Homes that are priced and presented correctly continue to close. The rest take longer.
Price per square foot adds useful context. While median and average sale prices moved slightly higher, price per square foot declined in many datasets. That usually means the mix of homes that sold got larger. Buyers are getting more house for their money than they did a year ago—a real gain the headline median alone doesn’t capture.
Rates have stayed relatively stable. The 30-year fixed has hovered in a tight band for weeks. Stability, more than any sharp drop, is what gets transactions done. Buyers and sellers who spent the last couple of years waiting for the perfect rate move appear to have mostly stopped waiting.
Key July numbers (Austin-Round Rock-San Marcos MSA)
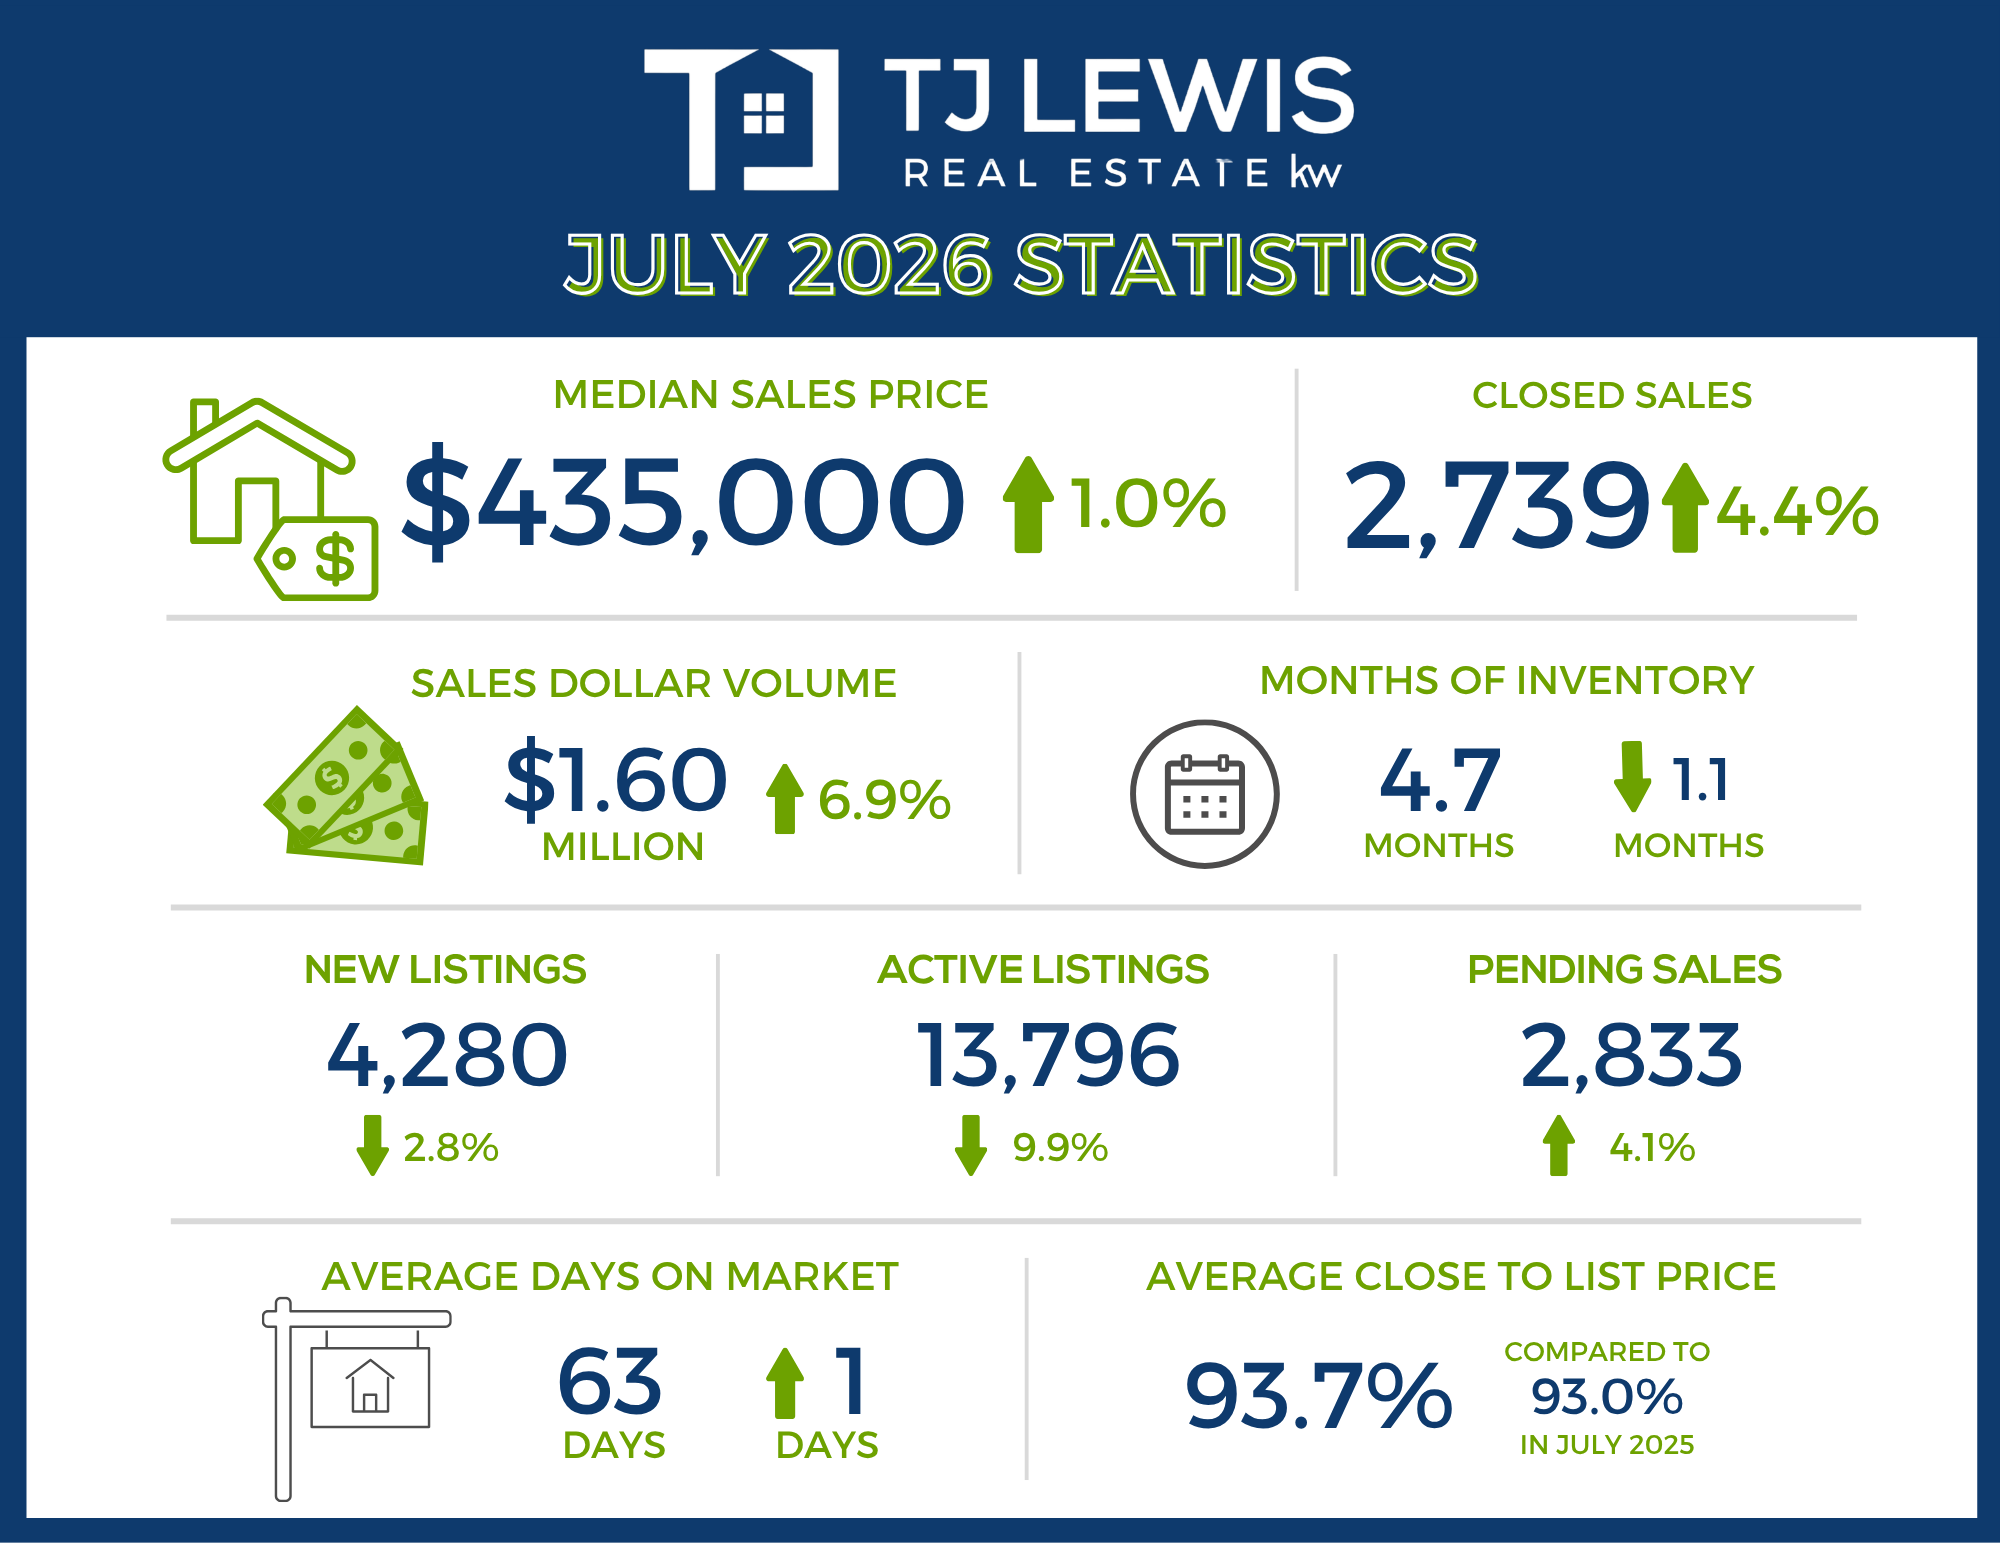
- Homes sold: 2,739 (+4.4% vs July 2025)
- Median price: $435,000 (+1.0%)
- New listings: 4,280 (–2.8%)
- Active listings: 13,796 (–9.9%)
- Pending sales: 2,833 (+4.1%)
- Months of inventory: 4.7 (–1.1 months)
- Dollar volume: $1.604 billion (+6.9%)
- Average close-to-list: 93.7% (up from 93.0%)
City of Austin and Travis County led the sales gains (both up more than 11%). Williamson County also posted solid growth. Hays and Bastrop were softer on closed volume but still showed activity on the pending side.
Affordability remains a longer-term concern. John Crowe, Unlock MLS and ABoR president, noted that a healthy market depends on creating opportunities for people both to buy and to stay in their homes. Ongoing costs—property taxes, insurance, utilities—matter. Every additional $100 a month in carrying costs pushes an estimated 9,800 Central Texas households across the cost-burdened threshold.
What this means right now
For buyers, this is becoming a more useful window. Inventory sits at the buyer-favorable end of a balanced market. Competition typically thins after Labor Day. You can ask for price, closing costs, repairs, or a rate buydown more effectively than in the spring. If you find the right house, waiting for more inventory next spring also means waiting for more competing buyers.
For sellers, the seasonal slowdown is arriving on schedule. Price to today’s market rather than to June’s numbers. A series of small reductions is usually the most expensive mistake in the fourth quarter. If you don’t need to sell this year, the better plan is often to prepare the house now and come to market in late Q1 when buyer energy returns.
Bottom line
July kept the broader 2026 story intact: more sales and more dollar volume than last year, prices that are essentially stable, and a market that is no longer extreme in either direction. It is balanced, selective, and increasingly normal. The best-positioned homes still move. The rest take longer and require realistic pricing.
Real estate remains hyperlocal. Conditions in your specific neighborhood can look different from the metro averages. If you want to walk through the numbers for your situation—whether you’re thinking about buying, selling, or simply watching the market—reach out anytime.
July 2026 - For Sale
-
2,739 – Residential homes sold, 4.4% more than July 2025.
-
$435,000 – Median price for residential homes, 1.0% more than July 2025.
-
4,280 – New home listings on the market, 2.8% less than July 2025.
-
13,796 – Active home listings on the market, 9.9% less than July 2025.
-
2,833 – Pending sales, 4.1% more than July 2025.
-
4.7 – Months of inventory, 1.1 less than July 2025.
-
$1,603,859,017 – Total dollar volume of homes sold, 6.9% more than July 2025.
-
93.7% – Average close to list price, compared to 93.0% in July 2025.
July 2026 - For Lease
-
3,230 – Closed leases, 6.5% less than July 2025.
-
$2,195 – Median price for rent, 0.2% less than July 2025.
-
4,021 – New lease listings on the market, 7.8% less than July 2025.
-
4,342 – Active lease listings on the market, 26.2% less than July 2025.
-
3,476 – Pending sales, 3.5% more than July 2025.
-
1.7 – Months of inventory, 0.3 months less than July 2025.
-
$7,735,652 – Total dollar volume of leases, 7.8% less than July 2025.
-
97.4% – Average close to list price, compared to 96.6% in July 2025.
City of Austin
July 2026 - For Sale
-
1,005 – Residential homes sold, 11.0% more than July 2025.
-
$577,000 – Median price for residential homes, 1.4% less than July 2025.
-
1,444 – New home listings on the market, 8.5% less than July 2025.
-
4,718 – Active home listings on the market, 18.2% less than July 2025.
-
999 – Pending sales, 4.2% more than July 2025.
-
4.5 – Months of inventory, 1.8 less than July 2025.
-
$762,759,192 – Total dollar volume of homes sold, 11.5% more than July 2025.
-
93.9% – Average close to list price, compared to 92.8% in July 2025.
July 2026 - For Lease
-
1,729 – Closed leases, 7.2% less than July 2025.
-
$2,200 – Median price for rent, 4.3% less than July 2025.
-
2,009 – New lease listings on the market, 11.4% less than July 2025.
-
2,133– Active lease listings on the market, 23.9% less than July 2025.
-
1,853 – Pending sales, 1.6% more than July 2025.
-
1.7 – Months of inventory, 0.2 months less than July 2025.
-
$4,309,483 – Total dollar volume of leases, 11.0% less than July 2025.
-
96.7% – Average close to list price, compared to 96.3% in July 2025.
Travis County
July 2026 - For Sale
-
1,290 – Residential homes sold, 11.4% more than July 2025.
-
$520,000 – Median price for residential homes, 0.3% less than July 2025.
-
1,972 – New home listings on the market, 3.3% less than July 2025.
-
6,586 – Active home listings on the market, 13.0% less than July 2025.
-
1,323 – Pending sales, 8.3% more than July 2025.
-
4.8 – Months of inventory, 1.7 months less than July 2025.
-
$909,515,300 – Total dollar volume of homes sold, 11.1% more than July 2025.
-
93.7% – Average close to list price, compared to 92.8% in July 2025.
July 2026 - For Lease
-
1,940 – Closed leases, 6.0% more than July 2025.
-
$2,200 – Median price for rent, 2.2% less than July 2025.
-
2,309 – New lease listings on the market, 9.2% less than July 2025.
-
2,611 – Active lease listings on the market, 20.3% less than July 2025.
-
2,107 – Pending sales, 4.0% more than July 2025.
-
1.9 – Months of inventory, 0.1 months less than July 2025.
-
$4,834,094 – Total dollar volume of leases, 8.7% less than July 2025.
-
96.7% – Average close to list price, compared to 96.3% in July 2025.
Williamson County
July 2026 - For Sale
-
957 – Residential homes sold, 6.0% more than July 2025.
-
$415,000 – Median price for residential homes, 1.2% less than July 2025.
-
1,534 – New home listings on the market, 2.7% more than July 2025.
-
4,258 – Active home listings on the market, 10.1% less than July 2025.
-
927 – Pending sales, 3.3% more than July 2025.
-
4.3 – Months of inventory, 0.9 months less than July 2025.
-
$461,708,126 – Total dollar volume of homes sold, 7.0% more than July 2025.
-
93.9% – Average close to list price, compared to 93.3% in July 2025.
July 2026 - For Lease
-
938 – Closed leases, 8.6% less than July 2025.
-
$2,200 – Median price for rent, 0.2% more than July 2025.
-
1,228 – New lease listings on the market, 8.2% less than July 2025.
-
1,190 – Active lease listings on the market, 38.4% less than July 2025.
-
998 – Pending sales, 0.7% more than July 2025.
-
1.4 – Months of inventory, 0.6 months less than July 2025.
-
$2,134,639 – Total dollar volume of leases, 7.5% less than July 2025.
-
98.5% – Average close to list price, compared to 97.1% in July 2025.
Hays County
July 2026 - For Sale
-
344 – Residential homes sold, 12.0% less than July 2025.
-
$367,700 – Median price for residential homes, 1.0% more than July 2025.
-
511 – New home listings on the market, 12.8% less than July 2025.
-
1,925 – Active home listings on the market, 5.4% less than July 2025.
-
409 – Pending sales, 7.9% less than July 2025.
-
5 – Months of inventory, 0.2 months less than July 2025.
-
$175,021,308 – Total dollar volume of homes sold, 6.5% less than July 2025.
-
93.4% – Average close to list price, compared to 92.7% to July 2025.
July 2026 - For Lease
-
275 – Closed leases, 0.7% less than July 2025.
-
$2,000 – Median price for rent, 4.8% less than July 2025.
-
368 – New lease listings on the market, 4.8% more than July 2025.
-
405 – Active lease listings on the market, 21.8% less than July 2025.
-
291 – Pending sales, 16.4% more than July 2025.
-
2.0 – Months of inventory, 2.0 months more than July 2025.
-
$611,093 – Total dollar volume of leases, 2.3% less than July 2025.
-
97.8% – Average close to list price, compared to 97.4% in July 2025.
Bastrop County
July 2026 - For Sale
-
110 – Residential homes sold, 16.0% less than July 2025.
-
$346,140 – Median price for residential homes, 2.3% more than July 2025.
-
204 – New home listings on the market, 3.3% less than July 2025.
-
758 – Active home listings on the market, 6.2% less than July 2025.
-
128 – Pending sales, 16.4% more than July 2025.
-
6.3 – Months of inventory, 0.3 months less than July 2025.
-
$44,677,852 – Total dollar volume of homes sold, 7.0% less than July 2025.
-
92.7% – Average close to list price, compared to 93.5% in July 2025.
July 2026 - For Lease
-
59 – Closed leases, 4.8% less than July 2025.
-
$1,950 – Median price for rent, 2.6% more than July 2025.
-
88 – New lease listings on the market, 8.3% less than July 2025.
-
106 – Active lease listings on the market, 10.9% less than July 2025.
-
61 – Pending sales, 4.7% less than July 2025.
-
2.4 – Months of inventory, 0.1 months less than July 2025.
-
$125,878 – Total dollar volume of leases, 3.0% more than July 2025.
-
97.8% – Average close to list price, compared to 96.7% in July 2025.
Caldwell County
July 2026 - For Sale
-
38 – Residential homes sold, 7.3% less than July 2025.
-
$254,000 – Median price for residential homes, 16.4% less than July 2025.
-
59 – New home listings on the market, 10.6% less than July 2025.
-
269 – Active home listings on the market, 59.2% more than July 2025.
-
46 – Pending sales, 6.1% less than July 2025.
-
7.7 – Months of inventory, 3.5 months more than July 2025.
-
$12,936,431– Total dollar volume of homes sold, 5.9% less than July 2025.
-
91.5% – Average close to list price, compared to 92.6% in July 2025.
July 2026 - For Lease
-
18 – Closed leases, 30.8% less than July 2025.
-
$1,774 – Median price for rent, 25.6% more than July 2025.
-
28 – New lease listings on the market, 17.6% less than July 2025.
-
30 – Active lease listings on the market, 25.0% less than July 2025.
-
19 – Pending sales, 34.5% less than July 2025.
-
1.0 – Months of inventory, 1.0 months more than July 2025.
-
$29,948 – Total dollar volume of leases, 21.9% less than July 2025.
-
98.6% – Average close to list price, compared to 98.1% in July 2025.
Recent Posts