November 2025 Central Texas Housing Market Report
November Market Update: Buyer Demand Holds Firm Despite Seasonal Slowdown
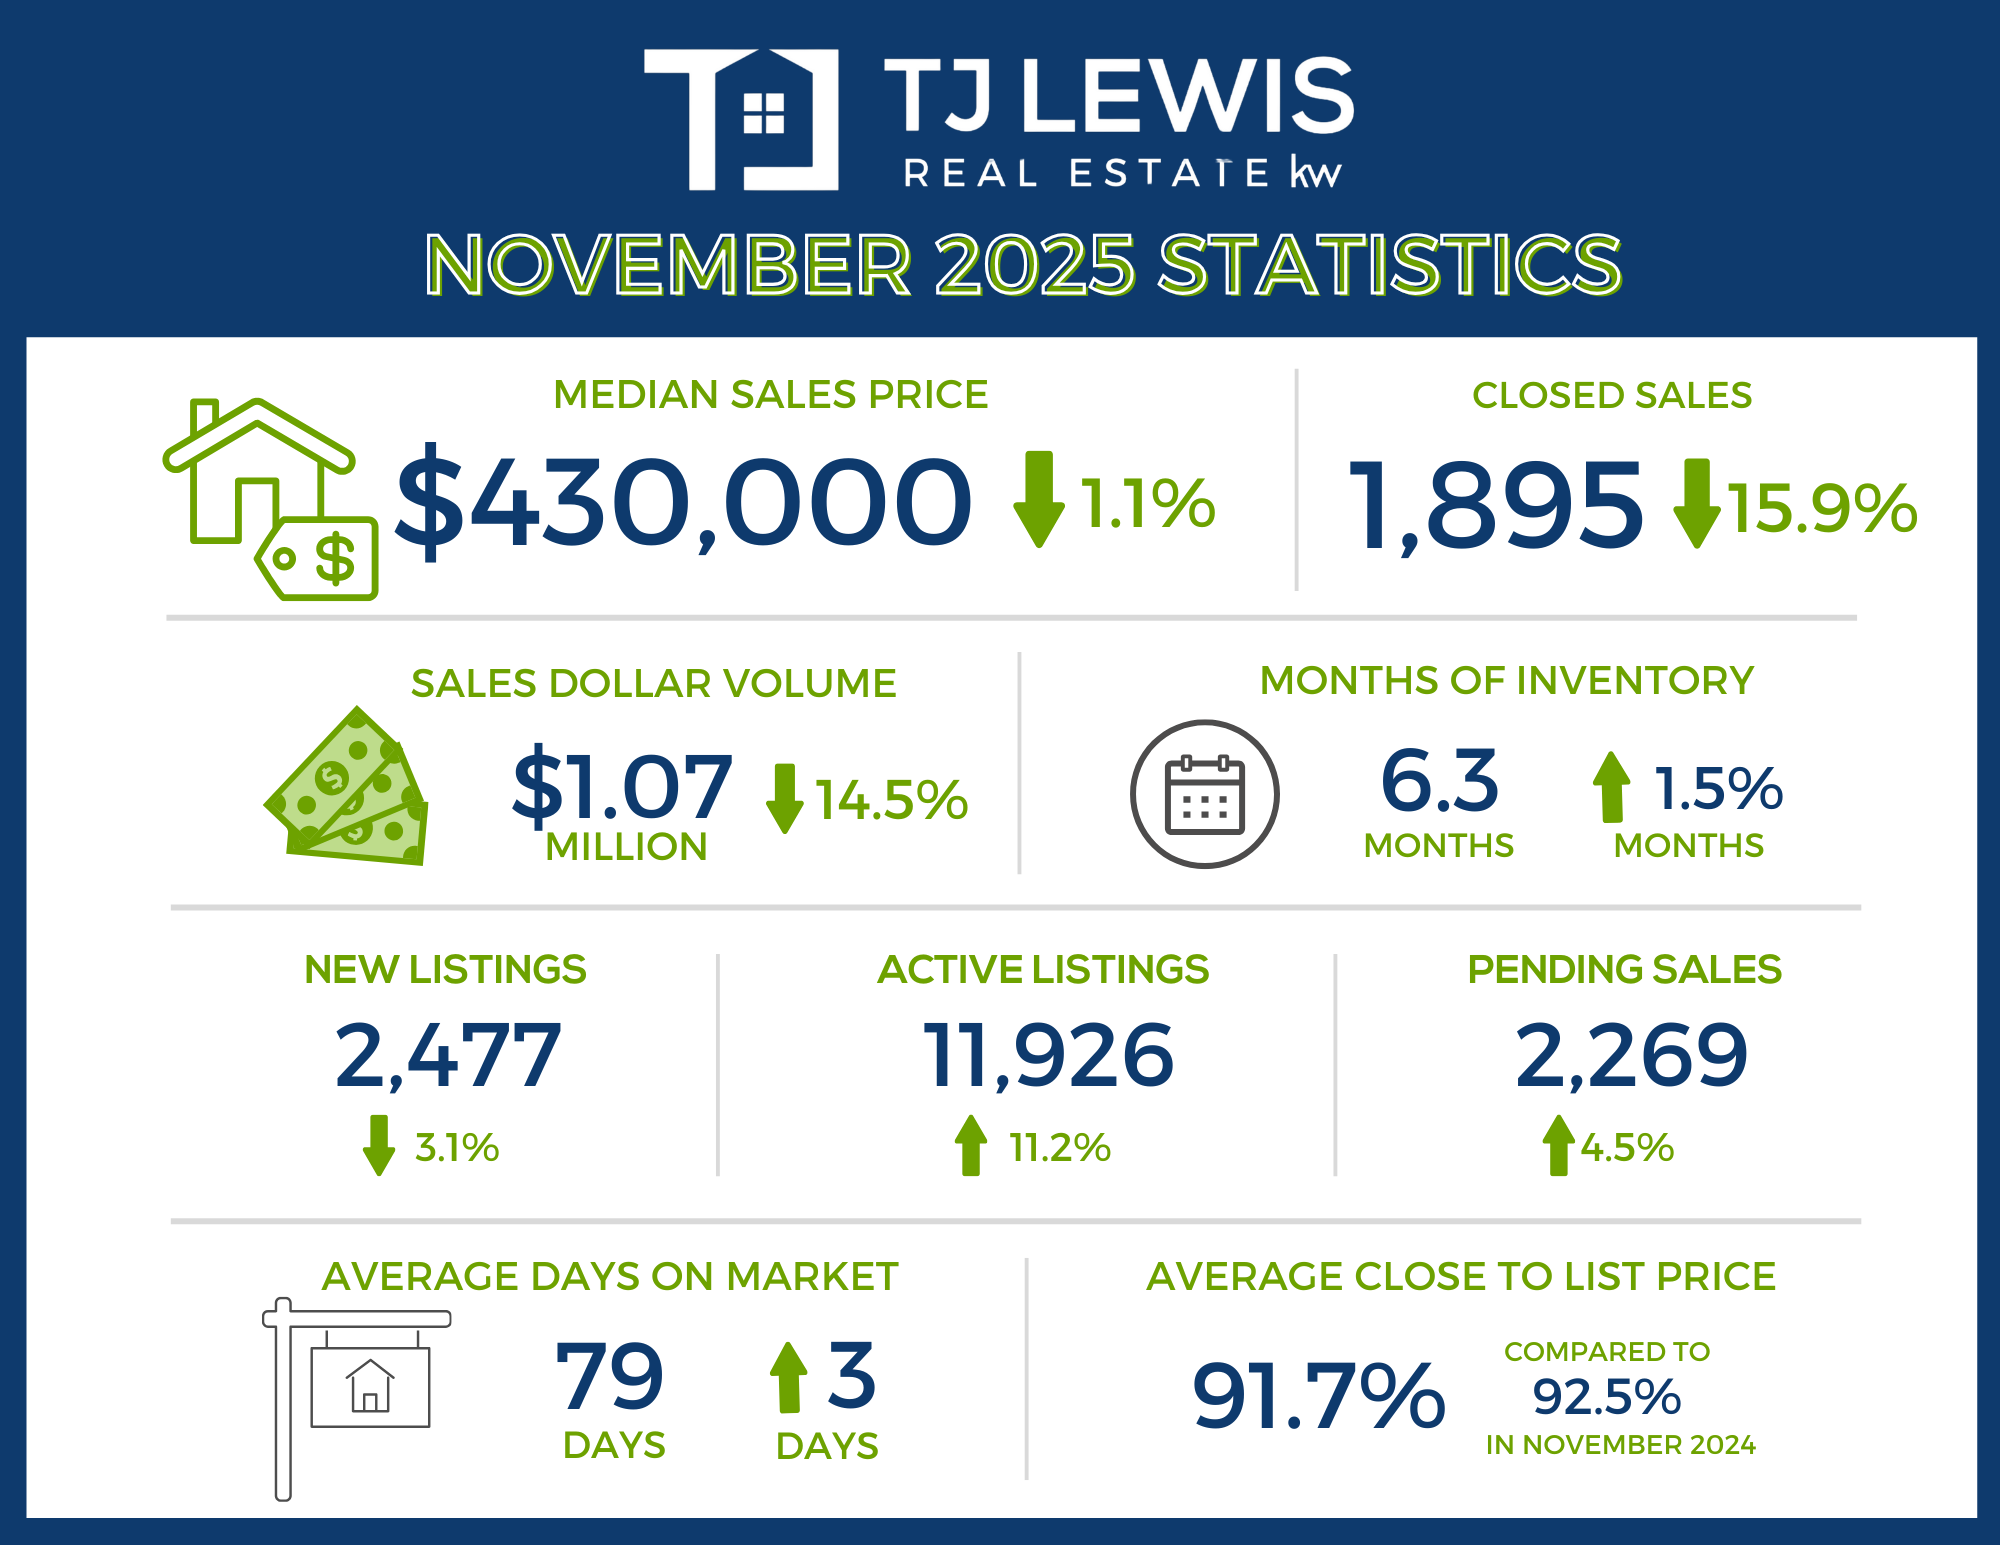
Even as the market heads into a traditionally slower time of year, Central Texas continues to show signs of underlying strength. According to the November 2025 Central Texas Housing Report from Unlock MLS, pending sales rose 4.5% to 2,269 across the Austin-Round Rock-San Marcos area. Inventory climbed to 6.3 months, the highest level seen in more than a year.
At the same time, the median sales price dipped slightly by 1.1% year over year to $430,000, while closed sales declined 15.9% to 1,895 transactions. While those headline numbers may seem concerning at first glance, there’s important context behind the shift.
Vaike O’Grady, market research advisor for Unlock MLS, explained why this year’s comparison looks sharper than normal: "It is important to remember that November 2024 sales were boosted by the Fed's first cut in interest rates, and mortgage rates moved accordingly. This year's 16% drop appears steeper than it might under typical conditions,” Vaike O’Grady, market research advisor for Unlock MLS, said. “While October’s government shutdown likely impacted November 2025 closings, the 5% year-over-year increase in pending sales is encouraging and shows that motivated buyers are reentering the market.”
O’Grady also pointed to reasons for optimism as we look ahead: “Last week’s Fed rate cut will likely bolster consumer confidence heading into 2026. As rates stabilize and buyers adjust to the new normal, we anticipate renewed momentum. The region’s long-term outlook is strong and will continue to buffer seasonal and economic shifts.”
Even in a slower season, opportunity still exists—especially for buyers and sellers who approach the market strategically.
Brandy Wuensch, 2025 Unlock MLS and ABoR president, emphasized the value of professional guidance in today’s environment: “Inventory is growing, prices are steady and buyers are reentering the market with a more strategic mindset. REALTORS® are playing a critical role in helping Central Texans navigate this evolving landscape with confidence. It's about positioning, not panic. Buyers finally have options, and sellers need to price their homes competitively based on current market conditions. Even though the pace is slower, Austin is still fundamentally strong."
As the year winds down, November’s data reinforces a familiar theme: the Central Texas housing market is adjusting, not weakening. With more inventory, stable pricing, and motivated buyers returning, the foundation remains strong heading into 2026.
Austin-Round Rock-San Marcos MSA
November 2025 - For Sale
-
1,895 – Residential homes sold, 15.9% less than November 2024.
-
$430,000 – Median price for residential homes, 1.1% less than November 2024.
-
2,477 – New home listings on the market, 3.1% less than November 2024.
-
11,926 – Active home listings on the market, 11.2% more than November 2024.
-
2,269 – Pending sales, 4.5% more than November 2024.
-
6.3 – Months of inventory, 1.5 months more than November 2024.
-
$1,078,709,812 – Total dollar volume of homes sold, 14.5% less than November 2024.
-
91.7% – Average close to list price, compared to 92.5% in November 2024.
November 2025 - For Lease
-
1,650 – Closed leases, 13.2% less than November 2024.
-
$2,100 – Median price for rent, 2.3 less than November 2024.
-
1,918 – New lease listings on the market, 5.7% less than November 2024.
-
5,401 – Active lease listings on the market, 4.7% more than November 2024.
-
1,722 – Pending leases, 6.8% less than November 2024.
-
3.0 – Months of inventory, flat compared to November 2024.
-
$4,011,037 – Total dollar volume of leases, 12.2% less than November 2024.
-
94.0% – Average close to list price, compared to 93.6% in November 2024.
City of Austin
November 2025 - For Sale
-
655 – Residential homes sold, 7.1% less than November 2024.
-
$565,000 – Median price for residential homes, 1.5% less than November 2024.
-
793 – New home listings on the market, 4.6% less than November 2024.
-
4,064 – Active home listings on the market, 6.9% more than November 2024.
-
753 – Pending sales, 5.5% more than November 2024.
-
4.9 – Months of inventory, 0.3 months more than November 2024.
-
$467,982,112 – Total dollar volume of homes sold, 12.7% less than November 2024.
-
91.8% – Average close to list price, compared to 91.6% in November 2024.
November 2025 - For Lease
-
762 – Closed leases, 13.0% less than November 2024.
-
$2,300 – Median price for rent, flat compared to November 2024.
-
888 – New lease listings on the market, 7.9% less than November 2024.
-
2,596 – Active lease listings on the market, 1.2% more than November 2024.
-
818 – Pending leases, 6.2% less than November 2024.
-
3.0 – Months of inventory, flat compared to November 2024.
-
$2,072,916 – Total dollar volume of leases, 11.2% less than November 2024.
-
93.8% – Average close to list price, compared to 93.4% in November 2024.
Travis County
November 2025 - For Sale
-
867 – Residential homes sold, 8.3% less than November 2024.
-
$505,000 – Median price for residential homes, 1.0% less than November 2024.
-
1,126 – New home listings on the market, 1.9% less than November 2024.
-
5,632 – Active home listings on the market, 9.4% more than November 2024.
-
996 – Pending sales, 2.5% more than November 2024.
-
5.2 – Months of inventory, 0.5 months more than November 2024.
-
$588,818,555 – Total dollar volume of homes sold, 9.7% less than November 2024.
-
91.9% – Average close to list price, compared to 92.1% in November 2024.
November 2025 - For Lease
-
908 – Closed leases, 9.0% less than November 2024.
-
$2,300 – Median price for rent, flat compared to November 2024.
-
1,099 – New lease listings on the market, 3.3% less than November 2024.
-
3,100 – Active lease listings on the market, 2.4% more than November 2024.
-
959 – Pending leases, 3.3% less than November 2024.
-
3.0 – Months of inventory, flat compared to November 2024.
-
$2,404,296 – Total dollar volume of leases, 8.6% less than November 2024.
-
93.9% – Average close to list price, compared to 93.5% in November 2024.
Williamson County
November 2025 - For Sale
-
661 – Residential homes sold, 17.1% less than November 2024.
-
$415,000 – Median price for residential homes, 3.5% less than November 2024.
-
791 – New home listings on the market, 6.7% more than November 2024.
-
3,717– Active home listings on the market, 20.1% more than November 2024.
-
799 – Pending sales, 7.4% more than November 2024.
-
4.5 – Months of inventory, 1.0 month more than November 2024.
-
$307,845,475 – Total dollar volume of homes sold, 20.1% less than November 2024.
-
91.7% – Average close to list price, compared to 93.3% in November 2024.
November 2025 - For Lease
-
551 – Closed leases, 18.6% less than November 2024.
-
$2,000 – Median price for rent, 4.5% less than November 2024.
-
601 – New lease listings on the market, 5.1% less than November 2024.
-
1,671 – Active lease listings on the market, 10.4% more than November 2024.
-
560 – Pending leases, 14.0% less than November 2024.
-
3.0 – Months of inventory, 1.0 months more than November 2024.
-
$1,166,559 – Total dollar volume of leases, 20.5% less than November 2024.
-
94.1% – Average close to list price, compared to 93.7% in November 2024.
Hays County
November 2025 - For Sale
-
266– Residential homes sold, 31.3% less than November 2024.
-
$390,000 – Median price for residential homes, 6.9% more than November 2024.
-
386 – New home listings on the market, 18.4% less than November 2024.
-
1,640 – Active home listings on the market, 3.3% less than November 2024.
-
341 – Pending sales, 1.8% more than November 2024.
-
4.4 – Months of inventory, 0.1 months less than November 2024.
-
$143,978,536 – Total dollar volume of homes sold, 18.0% less than November 2024.
-
91.0% – Average close to list price, compared to 91.9% in November 2024.
November 2025 - For Lease
-
147 – Closed leases, 16.9% less than November 2024.
-
$1,950 – Median price for rent, 2.3% less than November 2024.
-
159 – New lease listings on the market, 27.1% less than November 2024.
-
468 – Active lease listings on the market, 7.5% less than November 2024.
-
158 – Pending leases, 0.6% more than November 2024.
-
3.0 – Months of inventory, flat compared to November 2024.
-
$329,669 – Total dollar volume of leases, 11.0% less than November 2024.
-
93.6% – Average close to list price, compared to 93.8% in November 2024.
Bastrop County
November 2025 - For Sale
-
74 – Residential homes sold, 18.7% less than November 2024.
-
$365,000 – Median price for residential homes, 0.8% less than November 2024.
-
143 – New home listings on the market, 8.9% less than November 2024.
-
742 – Active home listings on the market, 15.4% more than November 2024.
-
101 – Pending sales, 5.2% more than November 2024.
-
7.2 – Months of inventory, 1.3 months more than November 2024.
-
$29,637,209 – Total dollar volume of homes sold, 22.5% less than November 2024.
-
91.0% – Average close to list price, compared to 92.0% in November 2024.
November 2025 - For Lease
-
33 – Closed leases, 21.4% less than November 2024.
-
$1,995 – Median price for rent, 5.0% more than November 2024.
-
48 – New lease listings on the market, 50.0% more than November 2024.
-
107 – Active lease listings on the market, 30.5% more than November 2024.
-
32 – Pending leases, 27.3% less than November 2024.
-
3.0 – Months of inventory, 1.0 months more than November 2024.
-
$67,983 – Total dollar volume of leases, 19.8% less than November 2024.
-
95.4% – Average close to list price, compared to 93.9% in November 2024.
Caldwell County
November 2025 - For Sale
-
27 – Residential homes sold, 15.6% less than November 2024.
-
$265,000– Median price for residential homes, 10.2% less than November 2024.
-
32 – New home listings on the market, 15.8% less than November 2024.
-
195 – Active home listings on the market, 40.3% more than November 2024.
-
32 – Pending sales, 33.3% more than November 2024.
-
6.1 – Months of inventory, 2.8 months more than November 2024.
-
$8,430,037 – Total dollar volume of homes sold, 15.5% less than November 2024.
-
89.8% – Average close to list price, compared to 94.1% in November 2024.
November 2025 - For Lease
-
11 – Closed leases, 37.5% more than November 2024.
-
$1,700 – Median price for rent, 8.1% less than November 2024.
-
17 – New lease listings on the market, 21.4% more than November 2024.
-
49 – Active lease listings on the market, 63.3% more than November 2024.
-
14 – Pending leases, 250.0% less than November 2024.
-
4.0 – Months of inventory, flat compared to November 2024.
-
$19,842 – Total dollar volume of leases, 27.7% more than November 2024.
-
97.4% – Average close to list price, compared to 100.0% in November 2024.
For more information or to download the November 2025 Central Texas Housing Market Report, visit UnlockMLS.com/Stats.
Recent Posts